Custom RSI & MACD Momentum Entry SignalsIndicator Explanation: Custom RSI & MACD Momentum Entry Signals
Introduction
The "Custom RSI & MACD Momentum Entry Signals" indicator combines the Relative Strength Index (RSI) and the Moving Average Convergence Divergence (MACD) to generate precise long and short entry signals. This indicator offers a powerful combination of overbought/oversold zones, momentum analysis, and RSI-EMA crossovers to assist traders in making better decisions.
How the Indicator Works
1. RSI Calculation and EMA
The RSI is calculated based on the closing price with an adjustable period (default: 14).
An Exponential Moving Average (EMA) of the RSI (default: 9) is plotted to identify RSI trend changes.
When the RSI crosses its EMA upwards, it signals a bullish impulse. Conversely, a downward cross indicates a bearish impulse.
2. MACD Calculation and Momentum Shifts
The MACD line is derived from the difference between a fast EMA (default: 12) and a slow EMA (default: 26).
The Signal line is the EMA of the MACD line (default: 9).
The MACD histogram represents the difference between the MACD line and the Signal line.
Momentum shifts are detected as follows:
Weakening Bearish: Histogram is negative but increasing (less bearish pressure).
Strengthening Bullish: Histogram is positive and rising.
Weakening Bullish: Histogram is positive but decreasing.
Strengthening Bearish: Histogram is negative and falling.
Signal Generation
Long Signals
A Long signal is triggered when all of the following conditions are met:
The RSI was previously below 30 (oversold condition).
MACD momentum shifts from "strengthening bearish" to "weakening bearish" or turns bullish.
The RSI crosses its EMA upwards.
A green upward arrow is displayed below the bar, and the background is lightly shaded green for additional visualization.
Short Signals
A Short signal is triggered when all of the following conditions are met:
The RSI was previously above 70 (overbought condition).
MACD momentum shifts from "strengthening bullish" to "weakening bullish" or turns bearish.
The RSI crosses its EMA downwards.
A red downward arrow is displayed above the bar, and the background is lightly shaded red for additional visualization.
Visual Elements
RSI and EMA:
The RSI is shown in purple.
The RSI EMA is shown in blue.
Horizontal lines at 30 (oversold) and 70 (overbought) provide additional context.
MACD:
The MACD line is displayed in blue.
The Signal line is displayed in orange.
The zero line is added for easier interpretation.
Signals:
Green arrows: Long signals.
Red arrows: Short signals.
Background color: Light green for long conditions, light red for short conditions.
Use Cases
This indicator is ideal for:
Trend Followers: Combining RSI and MACD allows traders to identify entry points during impulsive trend shifts.
Swing Traders: Long and short signals can be used at reversal points to capture short-term price movements.
Momentum Traders: By considering MACD momentum, the indicator provides additional confidence in signal generation.
Customizable Settings
The indicator provides flexible input options:
RSI Period (default: 14)
RSI EMA Period (default: 9)
MACD Parameters: Fast, slow, and signal EMAs can be adjusted.
Conclusion
The Custom RSI & MACD Momentum Entry Signals indicator is a powerful tool for traders looking to combine RSI and MACD to identify high-probability entry signals. With clear visualization and precise signal generation, traders can make decisions more efficiently and capitalize on market movements.
Search in scripts for "relative strength"

RSI and Bollinger Bands Screener [deepakks444]Indicator Overview
The indicator is designed to help traders identify potential long signals by combining the Relative Strength Index (RSI) and Bollinger Bands across multiple timeframes. This combination allows traders to leverage the strengths of both indicators to make more informed trading decisions.
Understanding RSI
What is RSI?
The Relative Strength Index (RSI) is a momentum oscillator that measures the speed and change of price movements. Developed by J. Welles Wilder Jr. for stocks and forex trading, the RSI is primarily used to identify overbought or oversold conditions in an asset.
How RSI Works:
Calculation: The RSI is calculated using the average gains and losses over a specified period, typically 14 periods.
Range: The RSI oscillates between 0 and 100.
Interpretation:
Key Features of RSI:
Momentum Indicator: RSI helps identify the momentum of price movements.
Divergences: RSI can show divergences, where the price makes a higher high, but the RSI makes a lower high, indicating potential reversals.
Trend Identification: RSI can also help identify trends. In an uptrend, the RSI tends to stay above 50, and in a downtrend, it tends to stay below 50.
Understanding Bollinger Bands
What is Bollinger Bands?
Bollinger Bands are a type of trading band or envelope plotted two standard deviations (positively and negatively) away from a simple moving average (SMA) of a price. Developed by financial analyst John Bollinger, Bollinger Bands consist of three lines:
Upper Band: SMA + (Standard Deviation × Multiplier)
Middle Band (Basis): SMA
Lower Band: SMA - (Standard Deviation × Multiplier)
How Bollinger Bands Work:
Volatility Measure: Bollinger Bands measure the volatility of the market. When the bands are wide, it indicates high volatility, and when the bands are narrow, it indicates low volatility.
Price Movement: The price tends to revert to the mean (middle band) after touching the upper or lower bands.
Support and Resistance: The upper and lower bands can act as dynamic support and resistance levels.
Key Features of Bollinger Bands:
Volatility Indicator: Bollinger Bands help traders understand the volatility of the market.
Mean Reversion: Prices tend to revert to the mean (middle band) after touching the bands.
Squeeze: A Bollinger Band Squeeze occurs when the bands narrow significantly, indicating low volatility and a potential breakout.
Combining RSI and Bollinger Bands
Strategy Overview:
The strategy aims to identify potential long signals by combining RSI and Bollinger Bands across multiple timeframes. The key conditions are:
RSI Crossing Above 60: The RSI should cross above 60 on the 15-minute timeframe.
RSI Above 60 on Higher Timeframes: The RSI should already be above 60 on the hourly and daily timeframes.
Price Above 20MA or Walking on Upper Bollinger Band: The price should be above the 20-period moving average of the Bollinger Bands or walking on the upper Bollinger Band.
Strategy Details:
RSI Calculation:
Calculate the RSI for the 15-minute, 1-hour, and 1-day timeframes.
Check if the RSI crosses above 60 on the 15-minute timeframe.
Ensure the RSI is above 60 on the 1-hour and 1-day timeframes.
Bollinger Bands Calculation:
Calculate the Bollinger Bands using a 20-period moving average and 2 standard deviations.
Check if the price is above the 20-period moving average or walking on the upper Bollinger Band.
Entry and Exit Signals:
Long Signal: When all the above conditions are met, consider a long entry.
Exit: Exit the trade when the price crosses below the 20-period moving average or the stop-loss is hit.
Example Usage
Setup:
Add the indicator to your TradingView chart.
Configure the inputs as per your requirements.
Monitoring:
Look for the long signal on the chart.
Ensure that the RSI is above 60 on the 15-minute, 1-hour, and 1-day timeframes.
Check that the price is above the 20-period moving average or walking on the upper Bollinger Band.
Trading:
Enter a long position when the criteria are met.
Set a stop-loss below the low of the recent 15-minute candle or based on your risk management rules.
Monitor the trade and exit when the RSI returns below 60 on any of the timeframes or when the price crosses below the 20-period moving average.
House Rules Compliance
No Financial Advice: This strategy is for educational purposes only and should not be construed as financial advice.
Risk Management: Always use proper risk management techniques, including stop-loss orders and position sizing.
Past Performance: Past performance is not indicative of future results. Always conduct your own research and analysis.
TradingView Guidelines: Ensure that any shared scripts or strategies comply with TradingView's terms of service and community guidelines.
Conclusion
This strategy combines RSI and Bollinger Bands across multiple timeframes to identify potential long signals. By ensuring that the RSI is above 60 on higher timeframes and that the price is above the 20-period moving average or walking on the upper Bollinger Band, traders can make more informed decisions. Always remember to conduct thorough research and use proper risk management techniques.

Kalman Synergy Oscillator (KSO)The Kalman Synergy Oscillator (KSO) is an innovative technical indicator that combines the Kalman filter with two well-established momentum oscillators: the Relative Strength Index (RSI) and Williams %R. This combination aims to provide traders with a more refined tool for market analysis.
The use of the Kalman filter is a key feature of the KSO. This sophisticated algorithm is known for its ability to extract meaningful signals from noisy data. In financial markets, this translates to smoothing out price action while maintaining responsiveness to genuine market movements. By applying the Kalman filter to price data before calculating the RSI and Williams %R, the KSO potentially offers more stable and reliable signals.
The synergy between the Kalman-filtered price data and the two momentum indicators creates an oscillator that attempts to capture market dynamics more effectively. The RSI contributes its strength in measuring the magnitude and speed of price movements, while Williams %R adds sensitivity to overbought and oversold conditions. Basing these calculations on Kalman-filtered data may help reduce false signals and provide a clearer picture of underlying market trends.
A notable aspect of the KSO is its dynamic weighting system. This approach adjusts the relative importance of the RSI and Williams %R based on their current strengths, allowing the indicator to emphasize the most relevant information as market conditions change. This flexibility, combined with the noise-reduction properties of the Kalman filter, positions the KSO as a potentially useful tool for different market conditions.
In practice, traders might find that the KSO offers several potential benefits:
Smoother oscillator movements, which could aid in trend identification and reversal detection.
Possibly reduced whipsaws, particularly in choppy or volatile markets.
Potential for improved divergence detection, which might lead to more timely reversal signals.
Consistent performance across different timeframes, due to the adaptive nature of the Kalman filter.
While the KSO builds upon existing concepts in technical analysis, its integration of the Kalman filter with traditional momentum indicators offers traders an interesting tool for market analysis. It represents an attempt to address common challenges in technical analysis, such as noise reduction and false signal minimization.
As with any technical indicator, the KSO should be used as part of a broader trading strategy rather than in isolation. Its effectiveness will depend on how well it aligns with a trader's individual approach and market conditions. For traders looking to explore a more refined momentum oscillator, the Kalman Synergy Oscillator could be a worthwhile addition to their analytical toolkit.

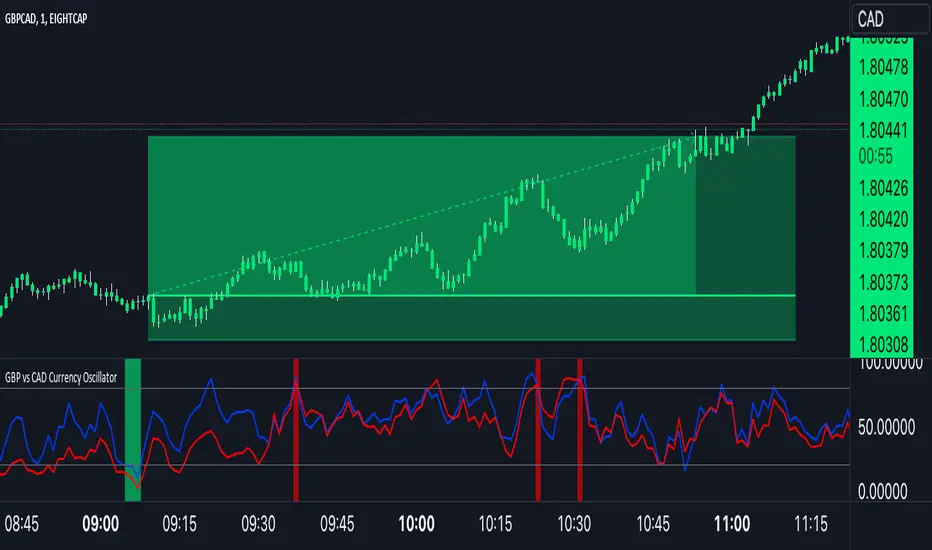
GBP Index vs CAD Index Currency OscillatorGBP vs CAD Currency Oscillator
This custom oscillator compares the relative strength of GBP (British Pound) and CAD (Canadian Dollar) against a basket of other currencies to determine potential overbought and oversold conditions. The indicator is designed to help traders evaluate momentum shifts and identify possible trend reversals between these two currencies, not just the GBPCAD pair.
How it Works:
Currency Index Calculation:
The oscillator calculates the average percentage change in 7 key GBP pairs (GBPUSD, EURGBP, GBPJPY, GBPAUD, GBPNZD, GBPCAD, and GBPCHF).
Similarly, it calculates the average percentage change for 7 key CAD pairs (USDCAD, EURCAD, CADJPY, AUDCAD, NZDCAD, GBPCAD, and CADCHF).
Stochastic Oscillator:
The indicator calculates a 0-100 oscillator for both the GBP and CAD currency indices based on the highest high and lowest low over a user-defined lookback period (default is 14 anlthough 60 works great on 1m chart).
The oscillator is smoothed using a simple moving average (default smoothing period is 3) to reduce noise and improve visual clarity.
Overbought/Oversold Conditions:
Overbought: When both the GBP and CAD oscillators exceed 80, the background turns red, indicating potential overbought conditions.
Oversold: When both oscillators fall below 20, the background turns green, signaling possible oversold conditions.
Crossovers:
When the GBP oscillator crosses above the CAD oscillator, a green dot appears at the bottom of the chart, signaling potential GBP strength.
When the GBP oscillator crosses below the CAD oscillator, a red dot appears, signaling potential CAD strength.
How to Use:
Overbought/Oversold Conditions: Use the red and green background highlights to spot potential overbought or oversold market conditions, helping you identify possible turning points.
Customization Options:
Lookback Period: You can adjust the lookback period for the stochastic calculation, allowing for sensitivity tuning (default: 14).
Smoothing Period: Control the degree of smoothing applied to the oscillators (default: 3).
This oscillator is ideal for traders focused on trading GBP and CAD pairs, offering a comparative analysis that can assist in better decision-making based on relative currency strength.
Uptrick: Market MoodsThe "Uptrick: Market Moods" indicator is an advanced technical analysis tool designed for the TradingView platform. It combines three powerful indicators—Relative Strength Index (RSI), Average True Range (ATR), and Bollinger Bands—into one cohesive framework, aimed at helping traders better understand and interpret market sentiment. By capturing shifts in the emotional climate of the market, it provides a holistic view of market conditions, which can range from calm to stressed or even highly excited. This multi-dimensional analysis tool stands apart from traditional single-indicator approaches by offering a more complete picture of market dynamics, making it a valuable resource for traders looking to anticipate and react to changes in market behavior.
The RSI in the "Uptrick: Market Moods" indicator is used to measure momentum. RSI is an essential component of many technical analysis strategies, and in this tool, it is used to identify potential market extremes. When RSI values are high, they indicate an overbought condition, meaning the market may be approaching a peak. Conversely, low RSI values suggest an oversold condition, signaling that the market could be nearing a bottom. These extremes provide crucial clues about shifts in market sentiment, helping traders gauge whether the current emotional state of the market is likely to result in a reversal. This understanding is pivotal in predicting whether the market is transitioning from calm to stressed or from excited to overbought.
The Average True Range adds another layer to this analysis by offering insights into market volatility. Volatility is a key factor in understanding the mood of the market, as periods of high volatility often reflect high levels of excitement or stress, while low volatility typically indicates a calm, steady market. ATR is calculated based on the range of price movements over a given period, and the higher the value, the more volatile the market is. The "Uptrick: Market Moods" indicator uses ATR to dynamically gauge volatility levels, helping traders understand whether the market is currently moving in a way that aligns with its emotional mood. For example, an increase in ATR accompanied by an RSI value that indicates overbought conditions could suggest that the market is in a highly excited state, with the potential for either strong momentum continuation or a sharp reversal.
Bollinger Bands complement these tools by providing visual cues about price volatility and the range within which the market is likely to move. Bollinger Bands plot two standard deviations away from a simple moving average of the price. This banding technique helps traders visualize how far the price is likely to deviate from its average over a certain period. The "Uptrick: Market Moods" indicator uses Bollinger Bands to establish price boundaries and identify breakout conditions. When prices break above the upper band or below the lower band, it often signals that the market is either highly stressed or excited. This breakout condition serves as a visual representation of the market mood, alerting traders to moments when prices are moving beyond typical ranges and when significant emotional shifts are occurring in the market.
Technically, the "Uptrick: Market Moods" indicator has been developed using TradingView’s Pine Script language, a highly efficient language for building custom indicators. It employs functions like ta.rsi, ta.atr, and ta.sma to perform the necessary calculations. The use of these built-in functions ensures that the calculations are both accurate and efficient, allowing the indicator to operate in real-time without lagging, even in volatile market conditions. The ta.rsi function is used to compute the Relative Strength Index, while ta.atr calculates the Average True Range, and ta.sma is used to smooth out price data for the Bollinger Bands. These functions are applied dynamically within the script, allowing the "Uptrick: Market Moods" indicator to respond to changes in market conditions in real time.
The user interface of the "Uptrick: Market Moods" indicator is designed to provide a visually intuitive experience. The market mood is color-coded on the chart, making it easy for traders to identify whether the market is calm, stressed, or excited at a glance. This feature is especially useful for traders who need to make quick decisions in fast-moving markets. Additionally, the indicator includes an interactive table that updates in real-time, showing the most recent mood state and its frequency. This provides valuable statistical insights into market behavior over specific time frames, helping traders track the dominant emotional state of the market. Whether the market is in a prolonged calm state or rapidly transitioning through moods, this real-time feedback offers actionable data that can help traders adjust their strategies accordingly.
The RSI component of the "Uptrick: Market Moods" indicator helps detect the speed and direction of price movements, offering insight into whether the market is approaching extreme conditions. By providing signals based on overbought and oversold levels, the RSI helps traders decide whether to enter or exit positions. The ATR element acts as a volatility gauge, dynamically adjusting traders’ expectations in response to changes in market volatility. Meanwhile, the Bollinger Bands help identify trends and potential breakout conditions, serving as an additional confirmation tool that highlights when the price has moved beyond normal boundaries, indicating heightened market excitement or stress.
Despite the robust capabilities of the "Uptrick: Market Moods" indicator, it does have limitations. In markets affected by sudden shifts, such as those driven by major news events or external economic factors, the indicator’s performance may not always be reliable. These external factors can cause rapid mood swings that are difficult for any technical analysis tool to fully anticipate. Additionally, the indicator’s complexity may pose a learning curve for novice traders, particularly those who are unfamiliar with the concepts of RSI, ATR, and Bollinger Bands. However, with practice, traders can become proficient in using the tool to its full potential, leveraging the insights it provides to better navigate market shifts.
For traders seeking a deeper understanding of market sentiment, the "Uptrick: Market Moods" indicator is an invaluable resource. It is recommended for those dealing with medium to high volatility instruments, where understanding emotional shifts can offer a strategic advantage. While it can be used on its own, integrating it with other forms of analysis, such as fundamental analysis and additional technical indicators, can enhance its effectiveness. By confirming signals with other tools, traders can reduce the likelihood of false signals and improve their overall trading strategy.
To further enhance the accuracy of the "Uptrick: Market Moods" indicator, it can be integrated with volume-based tools like Volume Profile or On-Balance Volume (OBV). This combination allows traders to confirm the moods identified by the indicator with volume data, providing additional confirmation of market sentiment. For example, when the market is in an excited mood, an increase in trading volume could reinforce the reliability of that signal. Conversely, if the market is stressed but volume remains low, traders may want to proceed with caution. Using multiple indicators together creates a more comprehensive trading approach, helping traders better manage risk and make informed decisions based on multiple data points.
In conclusion, the "Uptrick: Market Moods" indicator is a powerful and unique addition to the suite of technical analysis tools available on TradingView. It provides traders with a multi-dimensional view of market sentiment by combining the analytical strengths of RSI, ATR, and Bollinger Bands into a single tool. Its ability to capture and interpret the emotional mood of the market makes it an essential tool for traders seeking to gain an edge in understanding market behavior. While the indicator has certain limitations, particularly in rapidly shifting markets, its ability to provide real-time insights into market sentiment is a valuable asset for traders of all experience levels. Used in conjunction with other tools and sound trading practices, the "Uptrick: Market Moods" indicator offers a comprehensive solution for navigating the complexities of financial markets.

Post-Open Long Strategy with ATR-based Stop Loss and Take ProfitThe "Post-Open Long Strategy with ATR-Based Stop Loss and Take Profit" is designed to identify buying opportunities after the German and US markets open. It combines various technical indicators to filter entry signals, focusing on breakout moments following price lateralization periods.
Key Components and Their Interaction:
Bollinger Bands (BB):
Description: Uses BB with a 14-period length and standard deviation multiplier of 1.5, creating narrower bands for lower timeframes.
Role in the Strategy: Identifies low volatility phases (lateralization). The lateralization condition is met when the price is near the simple moving average of the BB, suggesting an imminent increase in volatility.
Exponential Moving Averages (EMA):
10-period EMA: Quickly detects short-term trend direction.
200-period EMA: Filters long-term trends, ensuring entries occur in a bullish market.
Interaction: Positions are entered only if the price is above both EMAs, indicating a consolidated positive trend.
Relative Strength Index (RSI):
Description: 7-period RSI with a threshold above 30.
Role in the Strategy: Confirms the market is not oversold, supporting the validity of the buy signal.
Average Directional Index (ADX):
Description: 7-period ADX with 7-period smoothing and a threshold above 10.
Role in the Strategy: Assesses trend strength. An ADX above 10 indicates sufficient momentum to justify entry.
Average True Range (ATR) for Dynamic Stop Loss and Take Profit:
Description: 14-period ATR with multipliers of 2.0 for Stop Loss and 4.0 for Take Profit.
Role in the Strategy: Adjusts exit levels based on current volatility, enhancing risk management.
Resistance Identification and Breakout:
Description: Analyzes the highs of the last 20 candles to identify resistance levels with at least two touches.
Role in the Strategy: A breakout above this level signals a potential continuation of the bullish trend.
Time Filters and Market Conditions:
Trading Hours: Operates only during the opening of the German market (8:00 - 12:00) and US market (15:30 - 19:00).
Panic Candle: The current candle must close negative, leveraging potential emotional reactions in the market.
Avoiding Entry During Pullbacks:
Description: Checks that the two previous candles are not both bearish.
Role in the Strategy: Avoids entering during a potential pullback, improving trade success probability.
Post-Open Long Strategy with ATR-Based Stop Loss and Take Profit
The "Post-Open Long Strategy with ATR-Based Stop Loss and Take Profit" is designed to identify buying opportunities after the German and US markets open. It combines various technical indicators to filter entry signals, focusing on breakout moments following price lateralization periods.
Key Components and Their Interaction:
Bollinger Bands (BB):
Description: Uses BB with a 14-period length and standard deviation multiplier of 1.5, creating narrower bands for lower timeframes.
Role in the Strategy: Identifies low volatility phases (lateralization). The lateralization condition is met when the price is near the simple moving average of the BB, suggesting an imminent increase in volatility.
Exponential Moving Averages (EMA):
10-period EMA: Quickly detects short-term trend direction.
200-period EMA: Filters long-term trends, ensuring entries occur in a bullish market.
Interaction: Positions are entered only if the price is above both EMAs, indicating a consolidated positive trend.
Relative Strength Index (RSI):
Description: 7-period RSI with a threshold above 30.
Role in the Strategy: Confirms the market is not oversold, supporting the validity of the buy signal.
Average Directional Index (ADX):
Description: 7-period ADX with 7-period smoothing and a threshold above 10.
Role in the Strategy: Assesses trend strength. An ADX above 10 indicates sufficient momentum to justify entry.
Average True Range (ATR) for Dynamic Stop Loss and Take Profit:
Description: 14-period ATR with multipliers of 2.0 for Stop Loss and 4.0 for Take Profit.
Role in the Strategy: Adjusts exit levels based on current volatility, enhancing risk management.
Resistance Identification and Breakout:
Description: Analyzes the highs of the last 20 candles to identify resistance levels with at least two touches.
Role in the Strategy: A breakout above this level signals a potential continuation of the bullish trend.
Time Filters and Market Conditions:
Trading Hours: Operates only during the opening of the German market (8:00 - 12:00) and US market (15:30 - 19:00).
Panic Candle: The current candle must close negative, leveraging potential emotional reactions in the market.
Avoiding Entry During Pullbacks:
Description: Checks that the two previous candles are not both bearish.
Role in the Strategy: Avoids entering during a potential pullback, improving trade success probability.
Entry and Exit Conditions:
Long Entry:
The price breaks above the identified resistance.
The market is in a lateralization phase with low volatility.
The price is above the 10 and 200-period EMAs.
RSI is above 30, and ADX is above 10.
No short-term downtrend is detected.
The last two candles are not both bearish.
The current candle is a "panic candle" (negative close).
Order Execution: The order is executed at the close of the candle that meets all conditions.
Exit from Position:
Dynamic Stop Loss: Set at 2 times the ATR below the entry price.
Dynamic Take Profit: Set at 4 times the ATR above the entry price.
The position is automatically closed upon reaching the Stop Loss or Take Profit.
How to Use the Strategy:
Application on Volatile Instruments:
Ideal for financial instruments that show significant volatility during the target market opening hours, such as indices or major forex pairs.
Recommended Timeframes:
Intraday timeframes, such as 5 or 15 minutes, to capture significant post-open moves.
Parameter Customization:
The default parameters are optimized but can be adjusted based on individual preferences and the instrument analyzed.
Backtesting and Optimization:
Backtesting is recommended to evaluate performance and make adjustments if necessary.
Risk Management:
Ensure position sizing respects risk management rules, avoiding risking more than 1-2% of capital per trade.
Originality and Benefits of the Strategy:
Unique Combination of Indicators: Integrates various technical metrics to filter signals, reducing false positives.
Volatility Adaptability: The use of ATR for Stop Loss and Take Profit allows the strategy to adapt to real-time market conditions.
Focus on Post-Lateralization Breakout: Aims to capitalize on significant moves following consolidation periods, often associated with strong directional trends.
Important Notes:
Commissions and Slippage: Include commissions and slippage in settings for more realistic simulations.
Capital Size: Use a realistic trading capital for the average user.
Number of Trades: Ensure backtesting covers a sufficient number of trades to validate the strategy (ideally more than 100 trades).
Warning: Past results do not guarantee future performance. The strategy should be used as part of a comprehensive trading approach.
With this strategy, traders can identify and exploit specific market opportunities supported by a robust set of technical indicators and filters, potentially enhancing their trading decisions during key times of the day.

Pulse Oscillator [UAlgo]The "Pulse Oscillator " is a trading tool designed to capture market momentum and trend changes by combining the strengths of multiple well-known technical indicators. By integrating the RSI (Relative Strength Index), CCI (Commodity Channel Index), and Stochastic Oscillator, this indicator provides traders with a comprehensive view of market conditions, offering both trend filtering and precise buy/sell signals. The oscillator is customizable, allowing users to fine-tune its parameters to match different trading strategies and timeframes. With its built-in smoothing techniques and level adjustments, the Pulse Oscillator aims to be a reliable tool for both trend-following and counter-trend trading strategies.
🔶 Key Features
Multi-Indicator Integration: Combines RSI, CCI, and Stochastic Oscillator to create a weighted momentum oscillator.
Why Use Multi-Indicator Integration?
Script uses Multi-Indicator Integration to combine the strengths of different technical indicators—such as RSI, CCI, and Stochastic Oscillator—into a single tool. This approach helps to reduce the weaknesses of individual indicators, providing a more comprehensive and reliable analysis of market conditions. By integrating multiple indicators, we can generate more accurate signals, filter out noise, and enhance our trading decisions.
Customizable Parameters: Allows users to adjust weights, periods, and smoothing techniques, providing flexibility to adapt the indicator to various market conditions.
Trend Filtering Option: An optional trend filter is available to enhance the accuracy of buy and sell signals, reducing the risk of false signals in choppy markets.
Dynamic Levels: The indicator dynamically calculates multiple levels of support and resistance, adjusting to market conditions with customizable decay factors and offsets.
Visual Clarity: The indicator visually represents different levels and trends with color-coded plots and fills, making it easier for traders to interpret market conditions at a glance.
Alerts: Configurable alerts for buy and sell signals, as well as trend changes, enabling traders to stay informed of key market movements without constant monitoring.
🔶 Interpreting the Indicator
Buy Signal: A buy signal is generated when the Slow Line crosses under the Fast Line during an uptrend or when the trend filter is disabled. This indicates a potential bullish reversal or continuation of an upward trend.
Sell Signal: A sell signal occurs when the Slow Line crosses above the Fast Line during a downtrend or when the trend filter is disabled, signaling a potential bearish reversal or continuation of a downward trend.
Trend Change: The indicator detects trend changes when the Fast Line shifts from increasing to decreasing or vice versa, providing early warning of possible market reversals.
Dynamic Levels: The indicator calculates upper and lower levels based on the Fast Line's values. These levels can be used to identify overbought or oversold conditions and potential areas of support or resistance.
🔶 Disclaimer
Use with Caution: This indicator is provided for educational and informational purposes only and should not be considered as financial advice. Users should exercise caution and perform their own analysis before making trading decisions based on the indicator's signals.
Not Financial Advice: The information provided by this indicator does not constitute financial advice, and the creator (UAlgo) shall not be held responsible for any trading losses incurred as a result of using this indicator.
Backtesting Recommended: Traders are encouraged to backtest the indicator thoroughly on historical data before using it in live trading to assess its performance and suitability for their trading strategies.
Risk Management: Trading involves inherent risks, and users should implement proper risk management strategies, including but not limited to stop-loss orders and position sizing, to mitigate potential losses.
No Guarantees: The accuracy and reliability of the indicator's signals cannot be guaranteed, as they are based on historical price data and past performance may not be indicative of future results.

RSI with Bollinger Bands Scalp Startegy (1min)
------------------------------------------------------------------------------
The "RSI with Bollinger Bands Scalp Strategy (1min)" is a highly effective tool designed for traders who engage in short-term scalping on the 1-minute chart. This indicator combines the strengths of the RSI (Relative Strength Index) and Bollinger Bands to generate precise buy signals, helping traders make quick and informed decisions in fast-moving markets.
How It Works:
RSI (Relative Strength Index):
The RSI is a widely-used momentum oscillator that measures the speed and change of price movements. It operates on a scale of 0 to 100 and helps identify overbought and oversold conditions in the market.
This strategy allows customization of the RSI's lower and upper bands (default settings: 30 for the lower band and 70 for the upper band) and the RSI length (default: 14).
Bollinger Bands:
Bollinger Bands consist of a central moving average (the basis) and two bands that represent standard deviations above and below the basis. These bands expand and contract based on market volatility.
In this strategy, the Bollinger Bands are used to identify potential buy and sell signals based on the price's relationship to the upper and lower bands.
Signal Generation:
Buy Signal: A buy signal is triggered when two conditions are met:
The RSI value falls below the specified lower band, indicating an oversold condition.
The price crosses below the lower Bollinger Band.
The buy signal is then issued on the first positive candle (where the closing price is greater than or equal to the opening price) after these conditions are met.
Sell Signal: In this version of the strategy, the sell signal is currently disabled to focus solely on generating and optimizing the buy signals for scalping.
Strategy Highlights:
This indicator is particularly effective for traders who focus on 1-minute charts and want to capitalize on rapid price movements.
The combination of RSI and Bollinger Bands ensures that buy signals are only generated during significant oversold conditions, helping to filter out false signals.
Customization:
Users can adjust the RSI length, Bollinger Bands length, and the standard deviation multiplier to better fit their specific trading style and the asset they are trading.
The moving average type for Bollinger Bands can be selected from various options, including SMA, EMA, SMMA, WMA, and VWMA, allowing further customization based on individual preferences.
Usage:
Use this indicator on a 1-minute chart to identify potential buy opportunities during short-term price dips.
Since the sell signals are disabled, this strategy is best used in conjunction with other indicators or strategies to manage exit points effectively.
This "RSI with Bollinger Bands Scalp Strategy (1min)" indicator is a valuable tool for traders looking to enhance their short-term trading performance by focusing on high-probability entry points in volatile market conditions.

Uptrick: Dynamic AMA RSI Indicator### **Uptrick: Dynamic AMA RSI Indicator**
**Overview:**
The **Uptrick: Dynamic AMA RSI Indicator** is an advanced technical analysis tool designed for traders who seek to optimize their trading strategies by combining adaptive moving averages with the Relative Strength Index (RSI). This indicator dynamically adjusts to market conditions, offering a nuanced approach to trend detection and momentum analysis. By leveraging the Adaptive Moving Average (AMA) and Fast Adaptive Moving Average (FAMA), along with RSI-based overbought and oversold signals, traders can better identify entry and exit points with higher precision and reduced noise.
**Key Components:**
1. **Source Input:**
- The source input is the price data that forms the basis of all calculations. Typically set to the closing price, traders can customize this to other price metrics such as open, high, low, or even the output of another indicator. This flexibility allows the **Uptrick** indicator to be tailored to a wide range of trading strategies.
2. **Adaptive Moving Average (AMA):**
- The AMA is a moving average that adapts its sensitivity based on the dominant market cycle. This adaptation allows the AMA to respond swiftly to significant price movements while smoothing out minor fluctuations, making it particularly effective in trending markets. The AMA adjusts its responsiveness dynamically using a calculated phase adjustment from the dominant cycle, ensuring it remains responsive to the current market environment without being overly reactive to market noise.
3. **Fast Adaptive Moving Average (FAMA):**
- The FAMA is a more sensitive version of the AMA, designed to react faster to price changes. It serves as a signal line in the crossover strategy, highlighting shorter-term trends. The interaction between the AMA and FAMA forms the core of the signal generation, with crossovers between these lines indicating potential buy or sell opportunities.
4. **Relative Strength Index (RSI):**
- The RSI is a momentum oscillator that measures the speed and change of price movements, providing insights into whether an asset is overbought or oversold. In the **Uptrick** indicator, the RSI is used to confirm the validity of crossover signals between the AMA and FAMA, adding an additional layer of reliability to the trading signals.
**Indicator Logic:**
1. **Dominant Cycle Calculation:**
- The indicator starts by calculating the dominant market cycle using a smoothed price series. This involves applying exponential moving averages to a series of price differences, extracting cycle components, and determining the instantaneous phase of the cycle. This phase is then adjusted to provide a phase adjustment factor, which plays a critical role in determining the adaptive alpha.
2. **Adaptive Alpha Calculation:**
- The adaptive alpha, a key feature of the AMA, is computed based on the fast and slow limits set by the trader. This alpha is clamped within these limits to ensure the AMA remains appropriately sensitive to market conditions. The dynamic adjustment of alpha allows the AMA to be highly responsive in volatile markets and more conservative in stable markets.
3. **Crossover Detection:**
- The indicator generates trading signals based on crossovers between the AMA and FAMA:
- **CrossUp:** When the AMA crosses above the FAMA, it indicates a potential bullish trend, suggesting a buy opportunity.
- **CrossDown:** When the AMA crosses below the FAMA, it signals a potential bearish trend, indicating a sell opportunity.
4. **RSI Confirmation:**
- To enhance the reliability of these crossover signals, the indicator uses the RSI to confirm overbought and oversold conditions:
- **Buy Signal:** A buy signal is generated only when the AMA crosses above the FAMA and the RSI confirms an oversold condition, ensuring that the signal aligns with a momentum reversal from a low point.
- **Sell Signal:** A sell signal is triggered when the AMA crosses below the FAMA and the RSI confirms an overbought condition, indicating a momentum reversal from a high point.
5. **Signal Management:**
- To prevent signal redundancy during strong trends, the indicator tracks the last generated signal (buy or sell) and ensures that the next signal is only issued when there is a genuine reversal in trend direction.
6. **Signal Visualization:**
- **Buy Signals:** The indicator plots a "BUY" label below the bar when a buy signal is generated, using a green color to clearly mark the entry point.
- **Sell Signals:** A "SELL" label is plotted above the bar when a sell signal is detected, marked in red to indicate an exit or shorting opportunity.
- **Bar Coloring (Optional):** Traders have the option to enable bar coloring, where green bars indicate a bullish trend (AMA above FAMA) and red bars indicate a bearish trend (AMA below FAMA), providing a visual representation of the market’s direction.
**Customization Options:**
- **Source:** Traders can select the price data input that best suits their strategy (e.g., close, open, high, low, or custom indicators).
- **Fast Limit:** Adjustable sensitivity for the fast response of the AMA, allowing traders to tailor the indicator to different market conditions.
- **Slow Limit:** Sets the slower boundary for the AMA’s sensitivity, providing stability in less volatile markets.
- **RSI Length:** The period for the RSI calculation can be adjusted to fit different trading timeframes.
- **Overbought/Oversold Levels:** These thresholds can be customized to define the RSI levels that trigger buy or sell confirmations.
- **Enable Bar Colors:** Traders can choose whether to enable bar coloring based on the AMA/FAMA relationship, enhancing visual clarity.
**How Different Traders Can Use the Indicator:**
1. **Day Traders:**
- **Uptrick: Dynamic AMA RSI Indicator** is highly effective for day traders who need to make quick decisions in fast-moving markets. The adaptive nature of the AMA and FAMA allows the indicator to respond rapidly to intraday price swings. Day traders can use the buy and sell signals generated by the crossover and RSI confirmation to time their entries and exits with greater precision, minimizing exposure to false signals often prevalent in high-frequency trading environments.
2. **Swing Traders:**
- Swing traders can benefit from the indicator’s ability to identify and confirm trend reversals over several days or weeks. By adjusting the RSI length and sensitivity limits, swing traders can fine-tune the indicator to catch longer-term price movements, helping them to ride trends and maximize profits over medium-term trades. The dual confirmation of crossovers with RSI ensures that swing traders enter trades that have a higher probability of success.
3. **Position Traders:**
- For position traders who hold trades over longer periods, the **Uptrick** indicator offers a reliable method to stay in trades that align with the dominant trend while avoiding premature exits. By adjusting the slow limit and extending the RSI length, position traders can smooth out the indicator’s sensitivity, allowing them to focus on major market shifts rather than short-term volatility. The bar coloring feature also provides a clear visual indication of the overall trend, aiding in trade management decisions.
4. **Scalpers:**
- Scalpers, who seek to profit from small price movements, can use the fast responsiveness of the FAMA in conjunction with the RSI to identify micro-trends within larger market moves. The indicator’s ability to adapt quickly to changing conditions makes it a valuable tool for scalpers looking to execute numerous trades in a short period, capturing profits from minor price fluctuations while avoiding prolonged exposure.
5. **Algorithmic Traders:**
- Algorithmic traders can incorporate the **Uptrick** indicator into automated trading systems. The precise crossover signals combined with RSI confirmation provide clear and actionable rules that can be coded into algorithms. The adaptive nature of the indicator ensures that it can be used across different market conditions and timeframes, making it a versatile component of algorithmic strategies.
**Usage:**
The **Uptrick: Dynamic AMA RSI Indicator** is a versatile tool that can be integrated into various trading strategies, from short-term day trading to long-term investing. Its ability to adapt to changing market conditions and provide clear buy and sell signals makes it an invaluable asset for traders seeking to improve their trading performance. Whether used as a standalone indicator or in conjunction with other technical tools, **Uptrick** offers a dynamic approach to market analysis, helping traders to navigate the complexities of financial markets with greater confidence.
**Conclusion:**
The **Uptrick: Dynamic AMA RSI Indicator** offers a comprehensive and adaptable solution for traders across different styles and timeframes. By combining the strengths of adaptive moving averages with RSI confirmation, it delivers robust signals that help traders capitalize on market trends while minimizing the risk of false signals. This indicator is a powerful addition to any trader’s toolkit, enabling them to make informed decisions with greater precision and confidence. Whether you're a day trader, swing trader, or long-term investor, the **Uptrick** indicator can enhance your trading strategy and improve your market outcomes.

Trend Deviation strategy - BTC [IkkeOmar]Intro:
This is an example if anyone needs a push to get started with making strategies in pine script. This is an example on BTC, obviously it isn't a good strategy, and I wouldn't share my own good strategies because of alpha decay.
This strategy integrates several technical indicators to determine market trends and potential trade setups. These indicators include:
Directional Movement Index (DMI)
Bollinger Bands (BB)
Schaff Trend Cycle (STC)
Moving Average Convergence Divergence (MACD)
Momentum Indicator
Aroon Indicator
Supertrend Indicator
Relative Strength Index (RSI)
Exponential Moving Average (EMA)
Volume Weighted Average Price (VWAP)
It's crucial for you guys to understand the strengths and weaknesses of each indicator and identify synergies between them to improve the strategy's effectiveness.
Indicator Settings:
DMI (Directional Movement Index):
Length: This parameter determines the number of bars used in calculating the DMI. A higher length may provide smoother results but might lag behind the actual price action.
Bollinger Bands:
Length: This parameter specifies the number of bars used to calculate the moving average for the Bollinger Bands. A longer length results in a smoother average but might lag behind the price action.
Multiplier: The multiplier determines the width of the Bollinger Bands. It scales the standard deviation of the price data. A higher multiplier leads to wider bands, indicating increased volatility, while a lower multiplier results in narrower bands, suggesting decreased volatility.
Schaff Trend Cycle (STC):
Length: This parameter defines the length of the STC calculation. A longer length may result in smoother but slower-moving signals.
Fast Length: Specifies the length of the fast moving average component in the STC calculation.
Slow Length: Specifies the length of the slow moving average component in the STC calculation.
MACD (Moving Average Convergence Divergence):
Fast Length: Determines the number of bars used to calculate the fast EMA (Exponential Moving Average) in the MACD.
Slow Length: Specifies the number of bars used to calculate the slow EMA in the MACD.
Signal Length: Defines the number of bars used to calculate the signal line, which is typically an EMA of the MACD line.
Momentum Indicator:
Length: This parameter sets the number of bars over which momentum is calculated. A longer length may provide smoother momentum readings but might lag behind significant price changes.
Aroon Indicator:
Length: Specifies the number of bars over which the Aroon indicator calculates its values. A longer length may result in smoother Aroon readings but might lag behind significant market movements.
Supertrend Indicator:
Trendline Length: Determines the length of the period used in the Supertrend calculation. A longer length results in a smoother trendline but might lag behind recent price changes.
Trendline Factor: Specifies the multiplier used in calculating the trendline. It affects the sensitivity of the indicator to price changes.
RSI (Relative Strength Index):
Length: This parameter sets the number of bars over which RSI calculates its values. A longer length may result in smoother RSI readings but might lag behind significant price changes.
EMA (Exponential Moving Average):
Fast EMA: Specifies the number of bars used to calculate the fast EMA. A shorter period results in a more responsive EMA to recent price changes.
Slow EMA: Determines the number of bars used to calculate the slow EMA. A longer period results in a smoother EMA but might lag behind recent price changes.
VWAP (Volume Weighted Average Price):
Default settings are typically used for VWAP calculations, which consider the volume traded at each price level over a specific period. This indicator provides insights into the average price weighted by trading volume.
backtest range and rules:
You can specify the start date for backtesting purposes.
You can can select the desired trade direction: Long, Short, or Both.
Entry and Exit Conditions:
LONG:
DMI Cross Up: The Directional Movement Index (DMI) indicates a bullish trend when the positive directional movement (+DI) crosses above the negative directional movement (-DI).
Bollinger Bands (BB): The price is below the upper Bollinger Band, indicating a potential reversal from the upper band.
Momentum Indicator: Momentum is positive, suggesting increasing buying pressure.
MACD (Moving Average Convergence Divergence): The MACD line is above the signal line, indicating bullish momentum.
Supertrend Indicator: The Supertrend indicator signals an uptrend.
Schaff Trend Cycle (STC): The STC indicates a bullish trend.
Aroon Indicator: The Aroon indicator signals a bullish trend or crossover.
When all these conditions are met simultaneously, the strategy considers it a favorable opportunity to enter a long trade.
SHORT:
DMI Cross Down: The Directional Movement Index (DMI) indicates a bearish trend when the negative directional movement (-DI) crosses above the positive directional movement (+DI).
Bollinger Bands (BB): The price is above the lower Bollinger Band, suggesting a potential reversal from the lower band.
Momentum Indicator: Momentum is negative, indicating increasing selling pressure.
MACD (Moving Average Convergence Divergence): The MACD line is below the signal line, signaling bearish momentum.
Supertrend Indicator: The Supertrend indicator signals a downtrend.
Schaff Trend Cycle (STC): The STC indicates a bearish trend.
Aroon Indicator: The Aroon indicator signals a bearish trend or crossover.
When all these conditions align, the strategy considers it an opportune moment to enter a short trade.
Disclaimer:
THIS ISN'T AN OPTIMAL STRATEGY AT ALL! It was just an old project from when I started learning pine script!
The backtest doesn't promise the same results in the future, always do both in-sample and out-of-sample testing when backtesting a strategy. And make sure you forward test it as well before implementing it!
Furthermore this strategy uses both trend and mean-reversion systems, that is usually a no-go if you want to build robust trend systems .
Don't hesitate to comment if you have any questions or if you have some good notes for a beginner.

ROCkin RSIROCkin RSI Indicator
Overview
The "ROCkin RSI" indicator combines the traditional Relative Strength Index (RSI) with an innovative approach using the Rate of Change (ROC) to offer a new way to visualize and interpret market momentum. By averaging the slope of the RSI over time and allowing for different types of moving averages, this indicator aims to help traders identify trending and reversal patterns more efficiently.
Features
RSI Calculations: The core of the indicator is based on the standard Relative Strength Index, an oscillator that measures the speed and change of price movements. The RSI oscillates between 0 and 100 and is usually used to identify overbought or oversold conditions.
Rate of Change of Price (ROC): Instead of simply plotting the RSI, this indicator calculates the Rate of Change of the closing price, essentially looking at how steep the RSI curve is over a user-defined period.
Smoothing: To reduce noise and make the curve smoother, the slope of the RSI is averaged over a given number of periods, which can either be a Simple Moving Average (SMA) or an Exponential Moving Average (EMA).
Column Plots: The smoothed RSI slope is plotted as columns, where the color of the columns (red or green) indicates whether the slope is positive or negative.
Optional RSI Moving Average: The indicator also offers an optional feature to plot a moving average of the smoothed RSI slope, aiding in trend identification.
Inputs
RSI Periods: The number of periods used to calculate the RSI.
Slope Periods: The number of periods used for calculating the Rate of Change.
Average Periods: The number of periods used for smoothing the RSI slope.
Type of Average: Choose between EMA (Exponential Moving Average) and SMA (Simple Moving Average) for smoothing.
Show RSI Moving Average: Toggle this to either show or hide the moving average of the smoothed RSI slope.
Moving Average Period: The period used for calculating the RSI Moving Average.
Moving Average Type: Choose between EMA and SMA for the RSI Moving Average.
How to Interpret
Positive Slope (Red Columns): Indicates upward momentum in the RSI, which may imply a bullish trend.
Negative Slope (Green Columns): Indicates downward momentum in the RSI, suggesting a possible bearish trend.
RSI Moving Average: Acts as a signal line to confirm the trend. When the smoothed RSI slope is above its moving average, it confirms the bullish trend, and when it's below, it confirms the bearish trend.
Practical Use
Entry/Exit Signals: Consider entering a long position when the columns of the green histogram cross above the moving average. Conversely, consider entering a short position when the columns cross under when red. The higher the columns the more likely the trade will be a good one.
Fine-Tuning and Optimization
It's crucial to understand that the default settings might not be optimal for all trading scenarios. The effectiveness of the ROCkin RSI indicator can vary based on the asset you're trading, the market conditions, and your trading style. Therefore, it's highly recommended to play with the settings and study the historical performance on the chart to grasp how the indicator behaves.
By experimenting with different periods for RSI, the Rate of Change, and the moving averages, you can tailor the indicator to better suit your needs. Studying how the indicator would have performed in the past can help you understand its potential strengths and weaknesses. Once you've got a feel for how it operates, you can then optimize the settings to align with your trading strategy and risk tolerance.

RSI Trendline Pro - Multi Confirmation
Overview
RSI Trendline Pro is an advanced Pine Script indicator that automatically draws trendlines on the RSI (Relative Strength Index) to detect support and resistance breakouts. It generates high-quality trading signals through a multi-confirmation system.
Key Features
Auto Trendlines: Detects pivot points on RSI to create intelligent support and resistance lines
Multi-Confirmation System: Combines Volume, Stochastic RSI, ADX, and Divergence filters to reduce false signals
RSI Divergence Detection: Automatically identifies bullish/bearish divergences between price and RSI
Live Dashboard: Displays RSI value, active trendlines, ADX strength, and last signal info on a visual panel
Smart Breakout Detection: Identifies trendline breaks and generates LONG/SHORT signals
How to Use
Add to TradingView: Paste code into Pine Editor and add to chart
Configure Parameters:
RSI Length: RSI period (default: 14)
Pivot Strength: Trendline sensitivity (lower = more lines)
Filters: Enable/disable Volume, Divergence, Stoch RSI, and ADX confirmations
Follow Signals:
LONG (Green): When RSI breaks resistance upward
SHORT (Red): When RSI breaks support downward
Divergence: "D" markers indicate potential trend reversals
Alert Setup
Script offers 4 alert types:
LONG Breakout: Resistance break
SHORT Breakout: Support break
Bullish/Bearish Divergence: Divergence detection
Any Signal: Combined alert for all signals
Best Practices
Prioritize high-volume breakouts (Volume Filter enabled)
Trends are stronger when ADX > 25
Confirm divergence signals with price action
Trade when 2-3 confirmations align

Directional Momentum VisualizerDescription
This script provides a color-coded column visualization of a classic momentum oscillator that measures relative strength and weakness. Instead of a single line, it uses conditional coloring to make directional changes easier to identify at a glance.
The tool is designed for clarity and adaptability, offering both column and line displays, with optional overbought, oversold, and midpoint guides.
How It Works
The script evaluates the oscillator’s value relative to a midpoint and its previous reading.
Depending on whether it’s above or below the midpoint — and whether it’s rising or falling — each column changes color:
Strong upward momentum (above midpoint and rising) → bright green
Fading upward momentum (above midpoint but falling) → pale green
Strong downward momentum (below midpoint and falling) → bright red
Fading downward momentum (below midpoint but rising) → pale red
Unchanged from the previous value → gray
This structure makes momentum shifts instantly visible without relying on line crossings or alerts.
Key Features
Color-coded momentum columns for instant visual interpretation
Adjustable midpoint, overbought, and oversold levels
Optional line overlay for smoother reference
Dynamic background highlighting in extreme zones
Works on any symbol or timeframe
Inputs Overview
Length: Controls the sensitivity of the oscillator calculation.
Source: Selects the price source (Close, HL2, etc.).
Midpoint Level: Defines the central reference level separating bullish and bearish momentum.
Show Line: Toggles visibility of the traditional line overlay.
Overbought / Oversold Levels: Define upper and lower boundaries for potential exhaustion zones.
How to Use
Add the script to your chart from the Indicators tab.
Adjust the midpoint and level settings to fit your preferred configuration.
Observe how column colors shift to reflect strength or weakness in momentum.
Use these transitions as visual context, not as trade signals.
How it Helps
This visual approach offers a clearer perspective on momentum dynamics by replacing the traditional single-line display with color-coded columns. The conditional coloring instantly reveals whether momentum is strengthening or weakening around a chosen midpoint, making trend shifts and fading pressure easier to interpret at a glance. It helps reduce visual noise and allows for quicker, more intuitive analysis of market behavior.
This tool is intended purely as a visual aid to help identify changing momentum conditions at a glance. It is not a buy or sell signal generator and should be used in combination with other forms of analysis and sound risk management.
⚠️ Disclaimer:
This script is provided for educational and informational purposes only. It is not financial advice and should not be considered a recommendation to buy, sell, or hold any financial instrument. Trading involves significant risk of loss and is not suitable for every investor. Users should perform their own due diligence and consult with a licensed financial advisor before making any trading decisions. The author does not guarantee any profits or results from using this script, and assumes no liability for any losses incurred. Use this script at your own risk.
byquan GP - SRSI Channel🔍 What Is It?
The GP – SRSI Channel is a momentum-based oscillator that measures the relative strength of price movements across multiple timeframes using the Stochastic RSI (SRSI) method.
Instead of using a single RSI line, this indicator analyzes four price inputs and four timeframes to create a dynamic channel that reflects the true market momentum — helping traders identify overbought and oversold zones with higher accuracy.
⚙️ How It Works
The indicator combines multiple layers of analysis to produce a smooth and reliable momentum channel.
1. Multi-Source RSI Calculation
It computes RSI and Stochastic RSI values for four different price sources:
Open
High
Low
Close
Each source generates its own SRSI value:
dsopen, dshigh, dslow, and dsclose
From these, it extracts:
starraymin: the lowest (most oversold) SRSI value
starraymax: the highest (most overbought) SRSI value
This forms a momentum range based on all price inputs.
2. Multi-Timeframe (MTF) Integration
To strengthen signal reliability, it repeats this SRSI analysis across four higher timeframes (configurable by user):
Parameter Default Value Meaning
Time 1 180 minutes 3-hour chart
Time 2 360 minutes 6-hour chart
Time 3 720 minutes 12-hour chart
Time 4 1D Daily chart
Each timeframe produces its own set of minimum, maximum, and close SRSI values.
These are then combined and normalized to a 0–100 scale.
3. Normalization and Channel Plot
The combined results create three main lines:
Min Line (Green–Red gradient) → represents oversold strength
Max Line (Green–Red gradient) → represents overbought strength
Close Line (White) → represents average SRSI value
The area between the Min and Max lines is filled with a color gradient to form the SRSI Channel, visually showing momentum strength and range.
4. Signal & Alerts
Two alert levels are defined:
Alert Min Level → Default = 5 (oversold)
Alert Max Level → Default = 95 (overbought)
When:
oranmin ≤ Alert Min Level → Market is in an oversold state (potential reversal up).
oranmax ≥ Alert Max Level → Market is in an overbought state (potential reversal down).
When either of these thresholds is crossed, the indicator triggers:
A white square marker on the chart.
A custom alert with the message:
“SRSI Channel reached alert threshold (oranmax ≥ MaxLevel or oranmin ≤ MinLevel)”
🧭 How to Use It
🪄 Step 1 — Add to Chart
Copy the code into a new Pine Script in TradingView.
Click Add to chart.
You’ll see three lines and a colored channel between them.
⚙️ Step 2 — Adjust Inputs
Core SRSI Settings
Setting Description
K, D Smoothing factors for Stochastic RSI.
RSI Length Number of bars for RSI calculation.
S Length Period used for %K in Stochastic RSI.
Alert Min/Max Level Defines oversold/overbought zones.
Multi-Timeframe Settings
Change Time 1 to Time 4 to suit your trading style:
Shorter timeframes → faster but more noise.
Longer timeframes → smoother, more reliable momentum.
📈 Step 3 — Interpret the Chart
Indicator Element Meaning
🟩 Lower Boundary (Min) Lowest SRSI reading → momentum weakness / possible rebound area
🟥 Upper Boundary (Max) Highest SRSI reading → strong momentum / possible exhaustion
⚪ Middle Line (Close) Average of all SRSI readings → overall momentum strength
🌈 Channel Fill Visualizes balance between overbought and oversold levels
When the channel widens → market volatility and strength increase.
When it narrows → consolidation or low-momentum phase.
🔔 Step 4 — Alerts
You can create alerts using:
Condition: SRSI Extreme
Message: SRSI Channel reached alert threshold
Use this to receive notifications when the market hits extreme momentum levels (great for reversal traders).
💡 Trading Tips
✅ Combine with Supertrend, MACD, or Moving Averages for confirmation.
✅ Look for SRSI extremes aligning with price support/resistance for stronger reversal entries.
✅ Use different timeframe combinations (e.g., 1H–4H–12H–1D) depending on your trading style.
✅ Treat it as a momentum filter — not a direct buy/sell signal tool.
⚖️ Summary
The GP – SRSI Channel is a sophisticated multi-timeframe momentum indicator that helps traders visualize market strength and identify overbought or oversold conditions with exceptional clarity.
Features:
4 price sources × 4 timeframes = deep momentum insight
Dynamic, color-coded SRSI channel
Built-in alert system for extreme conditions
Clean and intuitive visual design
Best suited for:
Swing and position traders
Traders who use RSI/Stoch indicators
Those seeking to confirm entries with multi-timeframe momentum data
🎯 Understand the market’s true momentum — before it moves.
MomentumMap — Relative Strength Visual Quadrant (RRG-Inspired)🔍 What is MomentumMap?
MomentumMap brings the concept of Relative Rotation Graphs (RRG) directly to your chart.
It helps you instantly see whether a symbol is leading, improving, weakening, or lagging — without scanning dozens of charts.
Unlike traditional RS indicators, this tool plots RS Ratio and RS Momentum together, classifying the current condition into clear quadrants.
🧩 Quadrant Logic
Zone Conditions Market Behavior
🟢 Power Zone RS > 1, Momentum > 0 Strong, leading, expanding trend
🟡 Drift Zone RS > 1, Momentum < 0 Cooling off after leadership
🔵 Lift Zone RS < 1, Momentum > 0 Early signs of strength emerging
🔴 Dead Zone RS < 1, Momentum < 0 Weak and lagging phase
Each bar’s background color reflects the active zone — giving instant visual feedback on rotation strength.
⚙️ Key Features
Benchmark-based RS Ratio & RS Momentum mapping
Auto-classified quadrant display with live background coloring
Optional Power Zone alert (with volume confirmation)
Adjustable RS smoothing and momentum periods
Works on all instruments and timeframes
💡 How to Use
Apply the indicator to any chart.
Choose your benchmark symbol (default: NSE:CNX500).
Observe the color-coded zones to assess strength rotation.
Use transitions between zones to identify:
New leadership → 🟢 Power Zone
Early rotation → 🔵 Lift Zone
Loss of strength → 🟡 Drift Zone
Weak performers → 🔴 Dead Zone
⚠️ Notes & Disclaimer
MomentumMap is an analytical visualization tool, not a buy/sell signal generator.
Choose benchmarks and timeframes that match your trading universe.
The script does not repaint and uses only confirmed bar data.
Past quadrant behavior does not guarantee future results.
Complies with TradingView’s open-source and originality guidelines.
📚 Credits
Concept inspired by Julius de Kempenaer’s RRG framework
Implementation and logic developed independently by Paritosh Gupta

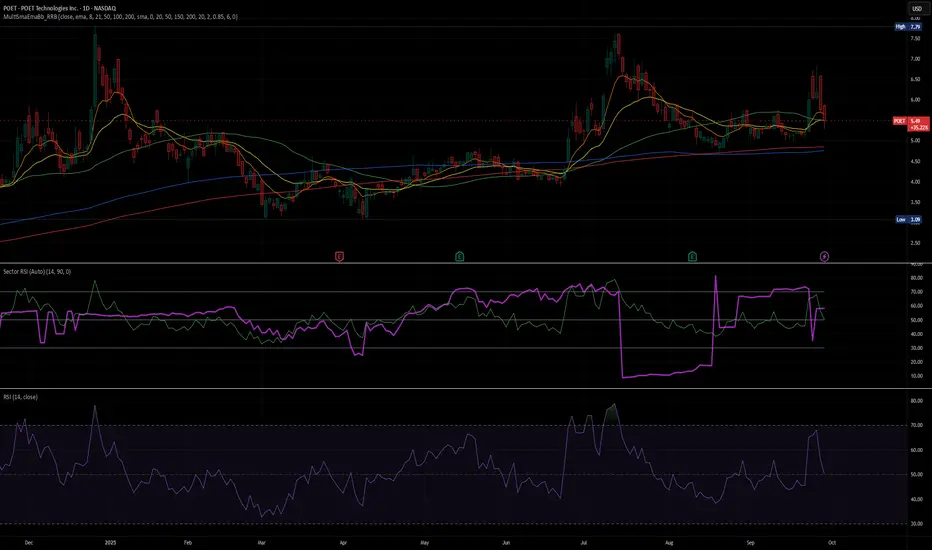
Sector RSI (Auto-Select)This indicator measures the relative strength momentum of any stock against its most closely correlated sector ETF, using the Relative Strength Index (RSI).
Auto sector selection: The script computes correlations between your symbol’s short-term returns and all major SPDR sector ETFs (XLB, XLE, XLF, XLI, XLK, XLP, XLU, XLV, XLY, XTN). The sector with the highest correlation is automatically chosen as the benchmark.
Sector vs Symbol RSI: It calculates RSI (default 14-period) for both the chosen sector and the current chart’s symbol.
Display modes:
Line mode: Plots both RSIs with colored fill (red if the sector RSI is stronger, green if the symbol RSI is stronger).
Histogram mode: Shows the difference between Sector RSI and Symbol RSI as a column chart.
RSI bands: Standard 70/50/30 reference lines are available in line mode.
Status line: The selected sector’s ticker is shown on the TradingView status line so you always know which sector is being used.
Use Cases:
Identify whether a stock’s momentum is driven by its sector or if it’s showing independent relative strength.
Detect sector rotations: when the stock begins to outperform or underperform its sector on momentum basis.
Combine with absolute RSI levels (overbought/oversold) to filter signals.
Notes:
This tool infers sector membership via rolling correlation, not from static classification metadata. This means in some cases (e.g. diversified companies or news shocks) the “best” sector may not be the official one, but the one most correlated in the current market regime.
Use min positive correlation input to filter out weak matches and enforce a fallback (defaults to Technology XLK).
Rocket Scan – Midday Movers (No Pullback)This indicator is designed to spot intraday breakout movers that often appear after the market open — the ones that rip out of nowhere and cause FOMO if you’re late.
🔑 Core Logic
• Momentum Burst: Detects sudden price pops (ROC) with confirming relative volume.
• Squeeze → Breakout: Finds low-volatility compressions (tight Bollinger bandwidth) and flags the first breakout move.
• VWAP Reclaims: Highlights strong reversals when price reclaims VWAP on volume.
• Relative Volume (RVOL): Filters for unusual activity vs. recent averages.
• Gap Filter: Skips large overnight gappers, focuses on fresh intraday movers.
• Relative Strength: Optional filter requiring the symbol to outperform SPY (and sector ETF if chosen).
• Session Window: Default 10:30–15:30 ET to ignore noisy open action and catch true midday moves.
🎯 Use Case
• Built for traders who want early alerts on midday runners without waiting for pullbacks.
• Helps identify potential entry points before FOMO kicks in.
• Works best on liquid tickers (stocks, ETFs, crypto) with reliable intraday volume.
📊 Visuals
• Plots fast EMA, slow EMA, and VWAP for trend context.
• Paints green ▲ for long signals and red ▼ for short signals on the chart.
• Info label shows RVOL, ROC, RS filter status, and gap conditions.
🚨 Alerts
Two alert conditions included:
• Rocket: Midday LONG → Fires when bullish conditions align.
• Rocket: Midday SHORT → Fires when bearish conditions align.
⸻
⚠️ Disclaimer:
This tool is for educational and research purposes only. It is not financial advice. Trading involves risk; always do your own research or consult a licensed professional.
TRI - Multi-Timeframe BIASTRI - MULTI-TIMEFRAME BIAS INDICATOR
DESCRIPTION:
Advanced multi-timeframe bias indicator that analyzes market sentiment across
5 different timeframes (15m, 1h, 4h, 1d, 1w) using adaptive technical analysis.
Provides clear directional bias signals to help determine market momentum.
KEY FEATURES:
ADAPTIVE PARAMETERS: Uses different EMA lengths and weights for each timeframe
EMA TREND ANALYSIS: Fast/slow EMA crossovers with slope analysis for momentum
RSI MOMENTUM: Adaptive overbought/oversold levels based on timeframe
ADX STRENGTH: Directional movement confirmation with DI+/DI- analysis
COMPOSITE SCORING: Weighted combination of trend, momentum, and strength
TIMEFRAME ANALYSIS:
15m: EMA9/21 + High momentum weight (45%) - Ultra-responsive for scalping
1h: EMA21/50 + Medium momentum weight (35%) - Balanced for day trading
4h: EMA50/200 + Lower momentum weight (25%) - Swing trading focus
1d: EMA50/200 + Trend focused (55%) - Position trading signals
1w: EMA50/200 + Maximum trend weight (60%) - Long-term bias
BIAS SIGNALS:
STRONG BULLISH/BEARISH: Score ≥ 0.5 - Very strong directional momentum
BULLISH/BEARISH: Score ≥ 0.25 - Clear directional signals
WEAK BULLISH/BEARISH: Score ≥ 0.1 - Mild directional bias
NEUTRAL: Score < 0.1 - No clear directional preference
ALERTS:
Major Bullish/Bearish: When 4H and 1D timeframes align
High confidence signals for strategic decision making
USAGE:
Higher timeframes (1d, 1w) show primary market direction
Lower timeframes (15m, 1h) provide entry timing
Look for alignment across multiple timeframes for stronger signals
Use confidence levels to assess signal reliability
TECHNICAL COMPONENTS:
Exponential Moving Averages (EMA) for responsive trend detection
Relative Strength Index (RSI) for momentum analysis
Average Directional Index (ADX) with DI+/DI- for trend strength
Volume ratio confirmation for signal validation
Adaptive thresholds optimized for each timeframe's characteristics

MS - Crypto RSI-Based Trading StrategyThis is a comprehensive trend-following and momentum-based strategy designed for the cryptocurrency market. It combines multiple leading indicators to filter out market noise and generate high-quality buy and sell signals.
Key Indicators:
Moving Average (MA): To determine the main trend direction.
Relative Strength Index (RSI): To measure momentum and identify overbought/oversold conditions.
Directional Movement Index (DMI): To confirm the strength of the trend.
Volume & ATR: To validate market interest and filter out excessive volatility.
Buy Conditions (All Must Be True):
Price and Trend Alignment: The current price is above the MA50 (with a 5% buffer).
Momentum Confirmation: The RSI is between 50 and 70.
Trend Strength: The +DI is greater than the -DI.
Market Interest: Volume is 1.5 times its moving average.
Low Volatility: The ATR is below its average.
Sell Conditions (Any One Is True):
Trend Reversal: The price drops below the MA50 (with a 5% buffer).
Momentum Loss: The RSI drops below 45.
Trend Weakness: The -DI crosses above the +DI.
Market Fatigue: Volume drops below 50% of its moving average.
High Volatility: The ATR is above its average.
Disclaimer: This is a backtesting tool and not financial advice. Past performance is not an indicator of future results. Always use proper risk management and conduct your own research before trading.

RSI Dynamic Bands█ OVERVIEW
The "RSI Dynamic Bands" indicator is a variant of the Relative Strength Index (RSI) oscillator that brings its signals directly onto the price chart. It displays dynamic bands around the price, adjusted based on RSI levels, enabling easy identification of potential overbought or oversold conditions. The indicator also integrates a multi-timeframe RSI table, facilitating the analysis of trend strength across different timeframes.
█ CONCEPTS
The "RSI Dynamic Bands" indicator is designed to simplify the interpretation of price levels in the context of support and resistance zones, which can be correlated with other technical indicators and RSI values. Since the price itself does not display RSI values, a table showing RSI for four selected timeframes has been added, allowing traders to quickly assess trend strength across different time intervals. The most effective approach is to combine the indicator with other technical analysis tools, such as Fibonacci levels or pivot points, to confirm signals when the price approaches the bands and RSI values indicate a potential reversal.
Band Calculation
The bands are calculated based on the current closing price and RSI values, incorporating dynamic scaling to better adapt to market conditions. The formulas for the bands are as follows:
• Upper Band: close + (rsiUpper - rsi) * scaleFactor, where rsiUpper is the upper RSI level (default: 70), and scaleFactor accounts for market volatility.
• Lower Band: close + (rsiLower - rsi) * scaleFactor, where rsiLower is the lower RSI level (default: 30).
• Midline: The arithmetic average of the upper and lower bands: (upperBand + lowerBand) / 2.
Why Scaling? Without scaling, the bands would be chaotic and jagged, making them difficult to interpret. Scaling smooths the bands, making them wider during periods of high volatility and narrower during consolidation, better reflecting potential support and resistance levels.
Indicator Features
• Dynamic Price Bands: The bands adapt to market conditions, facilitating the identification of key price levels.
• Multi-Timeframe RSI Table: Displays RSI values for four selected timeframes (default: 15m, 1h, 4h, Daily), enabling comparison of trend strength across different perspectives.
• Style Customization: Users can adjust band colors, line thickness, and toggle the visibility of bands, fills, and the table.
How to Set Up the Indicator
1 — Add the "RSI Dynamic Bands" indicator to your TradingView chart.
2 — Configure parameters in the settings, such as RSI length, upper/lower levels, and scaling multiplier, to match your trading style.
3 — Enable or disable the display of bands, fills, or the RSI table based on your needs.
4 — Adjust band and table colors in the input section and line thickness in the "Style" section to better align the indicator with your chart.
█ OTHER SECTIONS
FEATURES
• RSI Length: The period for calculating RSI (default: 14).
• RSI Levels: Thresholds for overbought (default: 70) and oversold (default: 30).
• Scaling Multiplier: Adjusts bands based on market volatility (default: 0.15).
• Table Timeframes: Select four timeframes for the RSI table (default: 15m, 1h, 4h, Daily).
• Style Options: Customize band colors, fills, table, and line thickness.
HOW TO USE
Add the indicator to your chart, configure the parameters, and observe price interactions with the bands to identify potential entry and exit points. The RSI table allows you to compare RSI values across different timeframes, aiding in trading decisions. The most effective approach is to combine the indicator with other technical analysis tools, such as Fibonacci levels or pivot points, to confirm signals when the price approaches the bands and RSI values indicate a potential reversal.
Trading Strategies:
• Scalping: Use lower timeframes (e.g., 5m, 15m) in the RSI table to quickly identify short-term lows and highs. Wait for the price to approach the lower band in the RSI oversold zone, with RSI on lower timeframes starting to rise, and other tools, such as Fibonacci levels (e.g., 38.2%) or pivot points, confirming support.
• Medium-Term Trading: Focus on 1h and 4h timeframes. Look for confirmation of a low on a lower timeframe (e.g., 1h), where RSI indicates oversold conditions or starts rising, then check if RSI on a higher timeframe (e.g., 4h) confirms the trend. Confirmation from other tools, such as a Fibonacci level (e.g., 50%) or pivot point near the bands, strengthens the signal.
• Long-Term Trading: Use Daily and higher timeframes (e.g., Weekly). Wait for all relevant timeframes to confirm a low (e.g., RSI near oversold and price at the lower band), with lower timeframes (e.g., 4h) showing rising RSI. Other tools, such as Fibonacci levels (e.g., 61.8%) or pivot points near the bands, can further confirm a trend reversal signal.

US Macro Cycle (Z-Score Model)US Macro Cycle (Z-Score Model)
This indicator tracks the US economic cycle in real time using a weighted composite of seven macro and market-based indicators, each converted into a rolling Z-score for comparability. The model identifies the current phase of the cycle — Expansion, Peak, Contraction, or Recovery — and suggests sector tilts based on historical performance in each phase.
Core Components:
Yield Curve (10y–2y): Positive & steepening = growth; inverted = slowdown risk.
Credit Spreads (HYG/LQD): Tightening = risk-on; widening = risk-off.
Sector Leadership (Cyclicals vs. Defensives): Measures market leadership regime.
Copper/Gold Ratio: Higher copper = growth signal; higher gold = defensive.
SPY vs. 200-day MA: Equity trend strength.
SPY/IEF Ratio: Stocks vs. bonds relative strength.
VIX (Inverted): Low/falling volatility = supportive; high/rising = risk-off.
Methodology:
Each series is transformed into a rolling Z-score over the selected lookback period (optionally using median/MAD for robustness and winsorization to clip outliers).
Z-scores are combined using user-defined weights and normalized.
The smoothed composite is compared against phase thresholds to classify the macro environment.
Features:
Customizable Weights: Emphasize the indicators most relevant to your strategy.
Adjustable Thresholds: Fine-tune cycle phase definitions.
Background Coloring: Visual cue for the current phase.
Summary Table: Displays composite Z, confidence %, and individual Z-scores.
Alerts: Trigger when the phase changes, with details on the composite score and recommended tilt.
Use Cases:
Align sector rotation or relative strength strategies with the macro backdrop.
Identify favorable or defensive phases for tactical allocation.
Monitor macro turning points to manage portfolio risk.
It's doesn't fill nan gaps so there is quite a bit of zeroes, non-repainting.

Multi TF Oscillators Screener [TradingFinder] RSI / ATR / Stoch🔵 Introduction
The oscillator screener is designed to simplify multi-timeframe analysis by allowing traders and analysts to monitor one or multiple symbols across their preferred timeframes—all at the same time. Users can track a single symbol through various timeframes simultaneously or follow multiple symbols in selected intervals. This flexibility makes the tool highly effective for analyzing diverse markets concurrently.
At the core of this screener lie two essential oscillators: RSI (Relative Strength Index) and the Stochastic Oscillator. The RSI measures the speed and magnitude of recent price movements and helps identify overbought or oversold conditions.
It's one of the most reliable indicators for spotting potential reversals. The Stochastic Oscillator, on the other hand, compares the current price to recent highs and lows to detect momentum strength and potential trend shifts. It’s especially effective in identifying divergences and short-term reversal signals.
In addition to these two primary indicators, the screener also displays helpful supplementary data such as the dominant candlestick type (Bullish, Bearish, or Doji), market volatility indicators like ATR and TR, and the four key OHLC prices (Open, High, Low, Close) for each symbol and timeframe. This combination of data gives users a comprehensive technical view and allows for quick, side-by-side comparison of symbols and timeframes.
🔵 How to Use
This tool is built for users who want to view the behavior of a single symbol across several timeframes simultaneously. Instead of jumping between charts, users can quickly grasp the state of a symbol like gold or Bitcoin across the 15-minute, 1-hour, and daily timeframes at a glance. This is particularly useful for traders who rely on multi-timeframe confirmation to strengthen their analysis and decision-making.
The tool also supports simultaneous monitoring of multiple symbols. Users can select and track various assets based on the timeframes that matter most to them. For example, if you’re looking for entry opportunities, the screener allows you to compare setups across several markets side by side—making it easier to choose the most favorable trade. Whether you’re a scalper focused on low timeframes or a swing trader using higher ones, the tool adapts to your workflow.
The screener utilizes the widely-used RSI indicator, which ranges from 0 to 100 and highlights market exhaustion levels. Readings above 70 typically indicate potential pullbacks, while values below 30 may suggest bullish reversals. Viewing RSI across timeframes can reveal meaningful divergences or alignments that improve signal quality.
Another key indicator in the screener is the Stochastic Oscillator, which analyzes the closing price relative to its recent high-low range. When the %K and %D lines converge and cross within the overbought or oversold zones, it often signals a momentum reversal. This oscillator is especially responsive in lower timeframes, making it ideal for spotting quick entries or exits.
Beyond these oscillators, the table includes other valuable data such as candlestick type (bullish, bearish, or doji), volatility measures like ATR and TR, and complete OHLC pricing. This layered approach helps users understand both market momentum and structure at a glance.
Ultimately, this screener allows analysts and traders to gain a full market overview with just one look—empowering faster, more informed, and lower-risk decision-making. It not only saves time but also enhances the precision and clarity of technical analysis.
🔵 Settings
🟣 Display Settings
Table Size : Lets you adjust the table’s visual size with options such as: auto, tiny, small, normal, large, huge.
Table Position : Sets the screen location of the table. Choose from 9 possible positions, combining vertical (top, middle, bottom) and horizontal (left, center, right) alignments.
🟣 Symbol Settings
Each of the 10 symbol slots comes with a full set of customizable parameters :
Enable Symbol : A checkbox to activate or hide each symbol from the table.
Symbol : Define or select the asset (e.g., XAUUSD, BTCUSD, EURUSD, etc.).
Timeframe : Set your desired timeframe for each symbol (e.g., 15, 60, 240, 1D).
RSI Length : Defines the period used in RSI calculation (default is 14).
Stochastic Length : Sets the period for the Stochastic Oscillator.
ATR Length : Sets the length used to calculate the Average True Range, a key volatility metric.
🔵 Conclusion
By combining powerful oscillators like RSI and Stochastic with full customization over symbols and timeframes, this tool provides a fast, flexible solution for technical analysts. Users can instantly monitor one or several assets across multiple timeframes without opening separate charts.
Individual configuration for each symbol, along with the inclusion of key metrics like candlestick type, ATR/TR, and OHLC prices, makes the tool suitable for a wide range of trading styles—from scalping to swing and position trading.
In summary, this screener enables traders to gain a clear, high-level view of various markets in seconds and make quicker, smarter, and lower-risk decisions. It saves time, streamlines analysis, and boosts overall efficiency and confidence in trading strategies.

Candle Count RSI📈 Candle Count RSI — A Dual-Perspective Momentum Engine
The Candle Count RSI is a custom-built momentum oscillator that expands on the classic Relative Strength Index (RSI) by introducing a directional-only variant that tracks the frequency of bullish or bearish closes, rather than price magnitude. It gives traders a second lens through which to evaluate momentum, trend conviction, and subtle divergences—often invisible to traditional price-based RSI.
💡 What Makes It Unique?
While the standard RSI is sensitive to the size of price changes, the Candle Count RSI is magnitude-blind. It counts candle closes above/below open over a lookback period, generating a purer signal of directional consistency. To enhance signal fidelity, it includes a streak amplifier, dynamically weighting extended runs of green or red candles to reflect intensity of market bias—without introducing artificial price sensitivity.
This dual-RSI approach allows for:
- Divergence detection between directional bias and price magnitude.
- Smoother trend confirmation in choppy markets.
- Cleaner visual cues using dynamic glow and background logic.
📐 How Standard RSI Actually Works (Not What You Think)
RSI doesn’t just check if price went up or down over a span—it checks each individual candle and tracks whether it closed higher or lower than the one before. Here's how it works under the hood:
1.) For each bar, it calculates the change from the previous close.
2.) It separates those changes into gains (upward moves) and losses (downward moves).
3.) Then it computes a smoothed average of those gains and losses (usually using an RMA).
4.) It calculates the Relative Strength (RS) as:
RS = AvgGain / AvgLoss
5.) Finally, it plugs that into the RSI formula:
RSI = 100 - (100 / (1 + RS))
⚖️ What Does the 50 Line Mean?
- The RSI scale runs from 0 to 100, but 50 is the true neutral zone:
- RSI > 50 means average gains outweigh average losses over the period.
- RSI < 50 means losses dominate.
- RSI ≈ 50? The market is balanced—momentum is indecisive, no clear trend bias.
- This makes 50 a powerful midline for trend filters, directional bias tools, and divergence detection—especially when paired with alternative RSI logic like Candle Count RSI.
🔧 Inputs and Customization
- Everything is fully modular and customizable:
🧠 Core Settings
- RSI Length: Used for both the standard RSI and Candle Count RSI.
📉 Standard RSI
- Classic RSI calculation based on price changes.
- Optional WMA smoothing to reduce noise.
- Glow effect toggle with custom intensity.
🕯 Candle Count RSI
- Computes RSI using only the count of up/down candles.
- Optional smoothing for stability.
- Amplifies streaks (e.g., multiple consecutive bullish candles increase strength).
- Glow effect toggle with adjustable strength.
🎇 Glow Visuals
- Background glow (subpane and/or main chart).
- Fades based on RSI distance from the 50 midpoint.
- Independent color settings for bull and bear bias.
🧬 Divergence Zones
- Detects when Candle RSI and Standard RSI diverge.
- Highlights:
- Bullish Divergence: Candle RSI > 50, Standard RSI < threshold.
- Bearish Divergence: Candle RSI < 50, Standard RSI > threshold.
- Background fill optionally shown in subpane and/or main chart.
📊 Directional Histogram
- MACD-style histogram showing the difference between the two RSI lines.
- Color-coded based on directional agreement:
- Both rising → green.
- Both falling → red.
- Conflict → yellow.
🧠 Under the Hood — How It Works
🔹 Standard RSI
- Classic ta.rsi() applied to close prices, optionally WMA-smoothed.
🔹 Candle Count RSI (CCR)
- Counts how many candles closed up/down over the period.
- Computes a magnitude-free RSI from these counts.
- Applies a streak-based multiplier to exaggerate trend strength during consecutive green/red runs.
- Optionally smoothed with WMA to create a clean signal line.
- This makes CCR ideal for detecting true directional bias without being faked out by volatile price spikes.
🔹 Divergence Logic
- When Candle RSI and Standard RSI disagree strongly across defined thresholds, background fills highlight early signs of momentum decay or hidden accumulation/distribution.
🔹 Glow Logic
- Glow zones are controlled by a master toggle and drawn with dynamic transparency:
- Further from 50 = stronger conviction = darker glow.
- Shows up in subpane and/or main chart depending on user preference.
📷 Suggested Use Case / Visual Setup
- Use in conjunction with your primary price action system.
- Watch for divergences between the Candle Count RSI and Standard RSI for early trend reversals.
- Use glow bias zones on the main chart to get subconscious directional cues during fast scalping.
- Histogram helps you confirm when both RSI variants agree—useful during strong trending conditions.
🛠️ Tip for Traders
- This tool isn’t trying to “predict” price. It’s designed to visualize hidden market psychology—when buyers are showing up with consistent pressure, or when momentum has a disconnect between conviction and magnitude. Use this to filter entries, spot weak rallies, or sense when a trend is about to break down.
⚠️ WARNING
- Not for use with Heikin Ashi, Renko, etc.).
🧠 Summary
Candle Count RSI is not just another mashup—it's a precision-built, dual-perspective oscillator that captures directional conviction using real candle behavior. Whether you're scalping intraday or swing trading momentum, this script helps clarify trend integrity and exposes hidden weaknesses with elegance and clarity.
—
🛠️ Built by: Sherlock_MacGyver
Feel free to share feedback or reach out if you'd like to collaborate on custom features.
